
Systematic Stock Control
Fitting and ForecastingSystematic Stock Control (SSC) is an analysis tool for time-series data. It looks at historical data, derives models that best scribe the pattern, and then makes predictions about what might happen next?
The basic functionality of the application includes
- Automatically downloading historical data for known stock keeping units
- Modelling the data looking for trends and seasonality, and how best to update those parameters over time
- Present information graphically including quality of fit and forecast
Additional analysis for buy and sell signals (DI)
- Hold until the upswing ends (data levelling off)
- Catch a peak when it occurs (do not wait for a slump)
- Automated paper buying and selling to determine profitability of the analysis
Support for multiple brokers, combining portfolios
- Tracking disparate purchases and sales under one view
- Calculate overall tax liability
- Overall portfolio performance, tracking all costs, dividends and fees
- FIFO (first in, first out) combined average purchase price calculations
- Accounting for all the costs of purchase and sale
- Showing combined returns across all brokerages
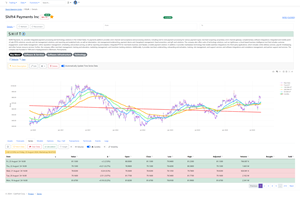
SSC ticker detail view includes
- Company name and description, logo and website url
- Market category information and reporting
- Custom tagging, ranking and bookmarking for tickers of interest
- Full history of daily stock prices and trading volumes
- Real-time price changes while the market is open, including pre and post market periods
- Company fundamentals and other attachments
- Ability to build custom data models and test personal forecasts
This is a sample screen showing the ticker detail view:
Alert information broadcasts (socials)
- SMS
- 𝕏.com
- bsky.social
- Discord